Crypto risk · reproducible historical study
Does Ethereum diversify Bitcoin downside?
What 731 daily observations show about shared risk, drawdowns and the benchmark behind a diversification claim.
In this fixed historical sample, the daily equal-weight mix had higher volatility and a deeper closing drawdown than BTC alone.
2024–2025 UTC
BTC and ETH
BTC’s worst 5%
Published research sample: 1 January 2024–31 December 2025 UTC. Data retrieved: 8 September 2026, 17:12:57–17:13:05 UTC. This is a historical case study, not a current market update. Figures are calculated from Coinbase Exchange BTC-USD and ETH-USD daily spot candles.
Holding two assets is not the same as holding two independent sources of risk. In this sample, adding ETH to BTC in a hypothetical daily-rebalanced 50/50 portfolio increased annualized daily volatility from 48.1% to 56.1%, and the largest closing drawdown from 32.1% to 48.1%. ETH fell on 36 of BTC's 37 worst days.
That does not make ETH universally unsuitable, nor prove the relationship will persist. It identifies a specific mistake: interpreting a correlation below one as evidence that a portfolio must be less risky than its lower-volatility component.
What we measured
The starting observations are the closing trades in Coinbase's UTC daily candles. We retain 732 consecutive daily closes for each asset, from 31 December 2023 through 31 December 2025. The first close provides the denominator for 1 January 2024's return, leaving 731 paired daily returns. We calculate simple returns as today's close divided by yesterday's close, minus one.
| Full-sample measure | BTC | ETH | Daily-rebalanced 50/50 |
|---|---|---|---|
| Annualized daily volatility | 48.1% | 70.2% | 56.1% |
| Maximum closing drawdown | −32.1% | −63.8% | −48.1% |
| Worst daily return | −8.6% | −14.7% | −11.7% |
| Average return on BTC's 37 worst days | −5.3% | −6.6% | −6.0% |
The 50/50 column is a hypothetical allocation that resets equal weights daily. It excludes fees, spreads, slippage and taxes. It is not a fund record or a proposed trading system.
Correlation describes co-movement, not protection
Daily BTC and ETH returns had Pearson correlation 0.791. Their risk was strongly shared, although not identical. The average of the standalone annualized volatilities was 59.2%; the 50/50 portfolio's 56.1% was lower than that average. There was a diversification effect in this narrow mathematical sense.
But BTC alone was less volatile at 48.1%. Mixing a more volatile asset into the portfolio can outweigh the benefit from imperfect correlation. A useful research report must identify the benchmark before describing a portfolio as “diversified” or “safer.”
The portfolio variance identity explains the result: equal weights imply one quarter of BTC variance, one quarter of ETH variance, plus one half of their covariance. Correlation is only one input; the sizes of the individual risks matter too.
What happened on BTC's worst days?
We sort the 731 daily BTC returns and select the lowest ceil(0.05 × 731) = 37. ETH was negative on 36 of these days—97.3% of that retrospectively selected group. Across those days, BTC averaged −5.3%, ETH −6.6%, and the daily 50/50 mix −6.0%.
This is a stress diagnostic rather than a probability forecast. It does not mean a future bad BTC day has a 97.3% chance of a negative ETH return. The selection is made after observing the entire sample; market regimes and daily return distributions can change.
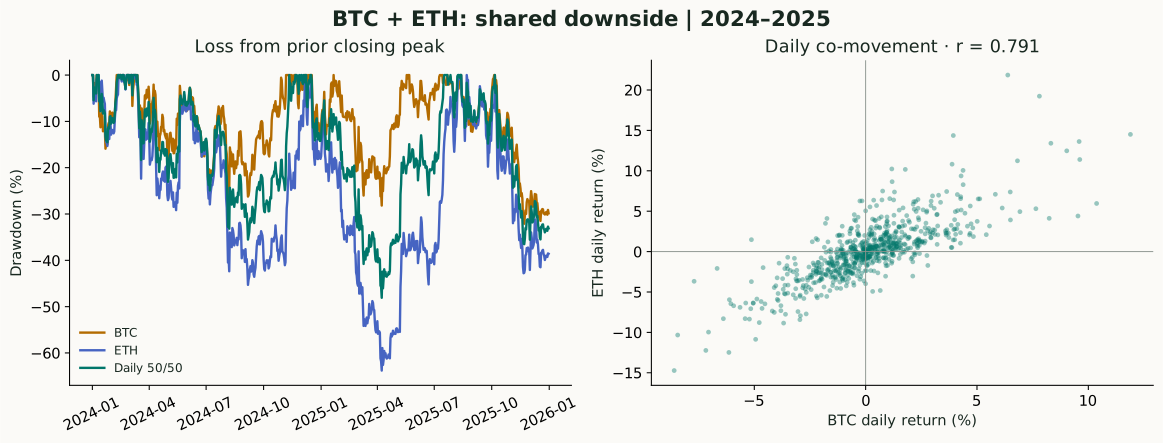
Coinbase Exchange daily candles; InfluencerQ calculations. Drawdowns include initial wealth of one, use closing observations, and exclude implementation costs. The final x-axis tick marks the 2026 boundary; the last observation is 31 December 2025.
Changing the sample changes the size of the risk
| Window | Daily correlation | BTC volatility | 50/50 volatility | BTC drawdown | 50/50 drawdown | ETH negative on BTC tail days |
|---|---|---|---|---|---|---|
| 2024 | 0.796 | 53.4% | 56.2% | −26.2% | −35.5% | 18/19 |
| 2025 | 0.816 | 41.9% | 56.0% | −32.1% | −45.1% | 19/19 |
| 2024–2025 | 0.791 | 48.1% | 56.1% | −32.1% | −48.1% | 36/37 |
Both calendar-year checks preserve the qualitative conclusion: the equal mix had greater volatility and deeper closing drawdowns than BTC alone. The magnitude changed substantially. ETH's standalone annualized volatility rose from 65.1% in 2024 to 75.1% in 2025 while BTC's fell.
The combined-period correlation need not equal the average of annual correlations: it is recomputed from all paired observations and their full-sample means. Likewise, a drawdown can cross the year boundary, so the two-year maximum is not an average of annual drawdowns.
What this means for research practice
Before treating an additional asset as protection, ask what risk it is meant to reduce, against which benchmark, over which horizon. Compare a covariance calculation with actual historical drawdowns and conditional loss days. Then vary the sample and state the costs and execution assumptions.
The accompanying marimo notebook exposes these steps, offers calendar-window and illustrative rebalance-fee controls, and lets readers inspect the raw data and calculations. Transparency here means inspectable inputs, methods and limitations—not merely a progress animation or a polished chart.
Boundaries and reproducibility
This study covers two chosen assets on one venue and two calendar years. It is not a consolidated market dataset. Daily closes omit intraday drawdowns, liquidity and liquidation risk. No statistical significance test, out-of-sample prediction, or future allocation claim is made. We did not investigate other assets or optimize a portfolio. Fees, taxes, custody risks and investor circumstances can change practical outcomes.
Coinbase warns that historical candles may be incomplete and requests can overlap the specified range. We retained the original six API responses, verified overlapping observations agreed, deduplicated timestamps, explicitly removed observations outside the sample and checked every expected daily timestamp. No missing daily closes remain in the retained sample. Exact request URLs and UTC retrieval timestamps are in sources.json.
Primary source: Coinbase Exchange candle endpoint and field definitions. Numerical findings above are our calculations from the saved raw responses, not claims made by Coinbase.
Download the free reproducibility bundle. It includes the marimo notebook, saved daily observations, exact source register, raw responses and independent audit. Follow README.md to run the notebook with its declared dependencies. A static snapshot does not preserve Python widget reactivity.
Inspect a different sample.
These controls show independently checked, precomputed statistics from the fixed public dataset. The downloadable marimo notebook reruns the calculations and includes a fee illustration.
2024–2025 · 731 daily returns. Correlation 0.791; ETH negative on 36/37 BTC tail days.
| Measure | BTC | Daily 50/50 |
|---|---|---|
| Annualized volatility | 48.1% | 56.1% |
| Maximum closing drawdown | −32.1% | −48.1% |
Each year resets starting wealth; combined drawdowns can cross year boundaries. Portfolio figures exclude implementation costs.
Source requests and data checks
Six Coinbase Exchange responses; 732 retained consecutive closes per asset; zero missing retained dates and zero conflicting overlap observations. Retrieval: 8 September 2026, 17:12:57–17:13:05 UTC.
- BTC-USD · raw/BTC-USD-2023-12-31.json · 2026-09-08T17:12:57.815044+00:00
- BTC-USD · raw/BTC-USD-2024-09-06.json · 2026-09-08T17:12:59.188675+00:00
- BTC-USD · raw/BTC-USD-2025-05-14.json · 2026-09-08T17:13:00.823582+00:00
- ETH-USD · raw/ETH-USD-2023-12-31.json · 2026-09-08T17:13:02.152359+00:00
- ETH-USD · raw/ETH-USD-2024-09-06.json · 2026-09-08T17:13:03.565717+00:00
- ETH-USD · raw/ETH-USD-2025-05-14.json · 2026-09-08T17:13:04.965235+00:00
Calculation results (JSON) · Daily closes (CSV) · Notebook, raw data and independent check (ZIP)